

The DFT
|
The Discrete Fourier Transform converts discrete data from a time wave into a frequency spectrum. Using the DFT implies that the finite segment that is analyzed is one period of an infinitely extended periodic signal.
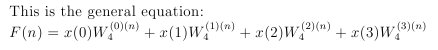
The DFT equation:
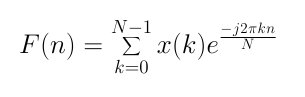
Equation 1
x(k) is the time wave that is converted to a frequency spectrum by the DFT.
Here are key concepts required to understand a DFT:
- The "sampling rate", sr. The sampling rate is the number of samples taken over a time period. For simplicity we will make the time interval between samples equal. This is the "sample interval", si.
- The fundamental period, T, is the period of all the samples taken. This is also called the "window".
- The "fundamental frequency" is f0, which is 1/T. f0 is the first harmonic, the second harmonic is 2*f0, the third is 3*f0, etc.
- The number of samples is N.
- The "Nyquist Frequency", fc, is half the sampling rate. The Nyquist frequency is the maximum frequency that can be detected for a given sampling rate. This is because in order to measure a wave you need at least two sample points to identify it (trough and peak).
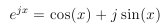
- "Euler's formula" --
- The sampled part of the time wave, x(t), should be "typical" of how the wave behaves over all time that it exists.
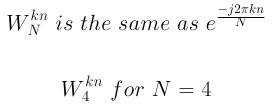
 This notation makes handling the exponential easier. This is sometimes called the "twiddle factor."
For simplicity, we will sample a sine wave with a small number of points, N, and perform a DFT on it, then we will employ each of the concepts above. Note, the sine wave is a time wave, and could be any wave in nature, for example a sound wave. The horizontal axis is time. The vertical axis is amplitude.
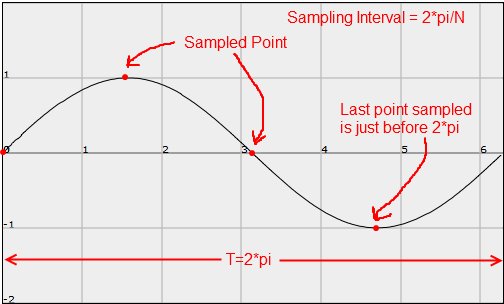
Diagram 1
Notice how in the diagram above we are sampling four points. The fundamental period, T, of the wave sampled is set to 2*pi. This applies to any wave we want to sample. The interval between samples is 2*pi/N, so in this case it is 2*pi/4. Thus, the interval between samples is pi/2 in this case.
The time wave is thus, x(k) = sin(pi/2*k) for k = 0 to N -1. The last point sampled is always the point just before 2*pi, because the wave is considered to be a repeating pattern and wraps around back to the value at k = 0, so you aren't missing any information.
We also need to know the time taken to sample the wave, so that we can tie it to a frequency. In our example, the time taken for the fundamental period, T, is 0.1 seconds (this value is measured when the wave is captured). That means the sine wave is a 10 Hz wave. Hertz = cycles per second. Also, the sampling interval, si, is the fundamental period time divided by the number of samples. So, si = T/N = (0.1)/4 seconds, or 0.025 seconds. The sampling rate, or frequency, sr, = 1/si = 40 Hz, or 40 samples per second.
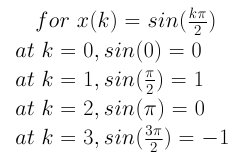
For the sine wave, the value at each of the four points sampled is:
And, before we plug into the DFT, some more on Wn, the twiddle factor, referenced above:
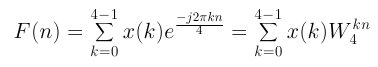
The DFT formula, then, for a four point sample and with the twiddle factor is:
Now, Euler's Formula for N=4:
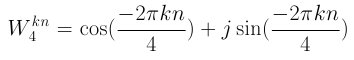
Equation 2
For the equation above, where k*n = 0 to N - 1, i.e. 0 to 3, here are the results:
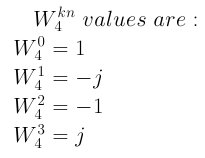
Notice that any additional integer values of kn will cycle back around. For example, kn = 4 cycles back to kn=0, so the value is 1. kn = 5 cycles back around to kn = 1, so the value is -j. The equation "kn modulus 4" determines which value of W is selected. Also, note that for larger samples the cycle is bigger. So for N=8 the equation would be "kn modulus 8". This is probably why W is called the "twiddle factor".
Now put this together for the DFT:
Here is the DFT worked out for all four points and for four frequencies:
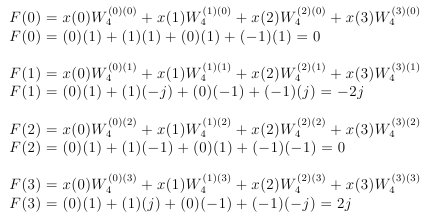
Evaluating the output data. Each F(n) value outputs a phase at a particular frequency. The frequency of the point is determined by the fundamental frequency multiplied by n, i.e. f = f0*n, where f0=1/T = 10Hz. The output values are the phase of the frequencies, which are represented by a real part and an imaginary part thus: real + j*imaginary. The fundamental frequency, first harmonic, is 10 Hz as calculated above. The magnitude at a frequency is Calculated thus sqrt(real*real + imaginary*imaginary).
Below is a frequency spectrum plot for the sine wave determined from the DFT we just worked through:
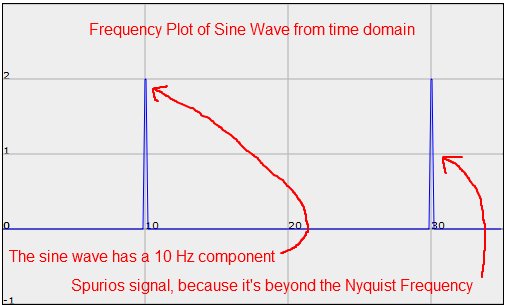
Diagram 2
The frequency plot is in the "frequency domain". The magnitudes are plotted in Diagram 2. The spike at 10 Hz shows that the DFT pulled out one of the frequencies that is in the sine wave. In fact, the sine wave is a 10 Hz sine wave, so that makes sense. However, the spike at 30 Hz should not be there, because there is no 30 Hz wave in the sine wave. So what accounts for that spike? Well, this is where the Nyquist Frequency, fc, mentioned above comes in. The Nyquist frequency is the cut off point above which the data from the DFT is no longer valid. The sampling rate is 40 Hz, and fc is half the sampling frequency, which means that any frequency above 20 Hz will not be valid in this case. So, the 30 Hz frequency is a spurious signal.
That completes analysis of a very simple wave.
Most waves will have many more frequencies in them, and thus many more spikes of various magnitudes along the frequency spectrum. For example, Diagram 3, below, is a plot of a triangle wave in time and its corresponding frequency spectrum:
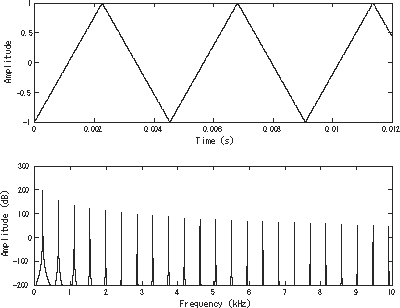
Diagram 3
The Next section is on the FFT. The FFT builds on the knowledge of the DFT described above, so it should be understood before moving on to the FFT.
| << Previous | Next >> |