

The Frequency Domain
|
Once you know the fundamental frequency and the coefficients of the Fourier Series, you can graph any complex wave in a frequency domain (aka frequency spectrum) and completely describe that wave. Frequency domain plots are often easier to analyze and understand than time domain wave plots are.
Example, below are two time wave plots of simple waves and a composite complex, periodic wave made from those two components:
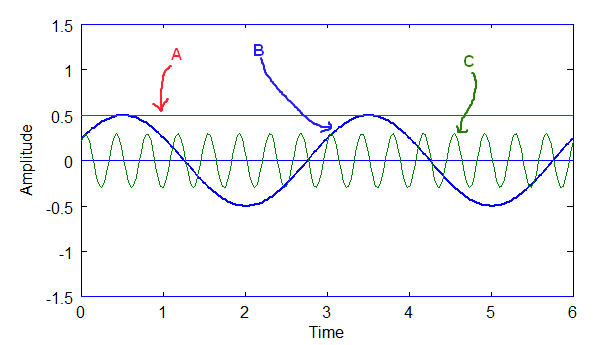
Above: The components of a time wave in the time domain. Components A, B and C.
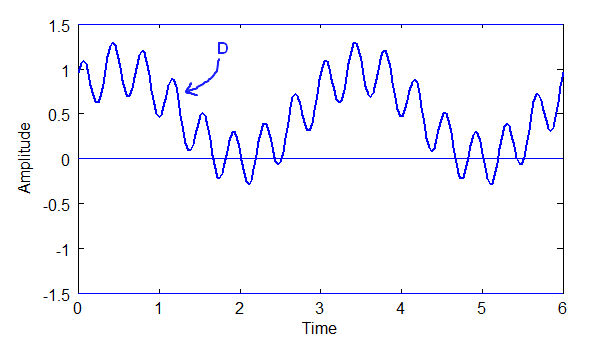
Above: The time wave, D, where D = A + B + C.
The diagrams above are ground we've already covered and should be understood at this point.
A frequency plot of the above wave is a plot of the magnitudes of the sinusoidal components at their respective frequencies, along with a plot of the DC component at frequency 0.
The DC component above is A = 0.5
The sinusoidal component B = 0.5 * sin(2wt + 0.52)
The sinusoidal component C = 0.3 * sin(16wt + 0.78)
Now, Fourier is most often broken down into sines and cosines, which allows us to deal with phase shift. Remember the trigonometric identity introduced earlier:
Equation 1
Using this identity, B = 0.5* cos(0.52)*sin(2wt) + 0.5*sin(0.52)*cos(2wt)
and C = 0.3*cos(0.78)*sin(16wt) + 0.3*sin(0.78)*cos(16wt)
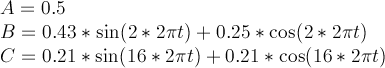
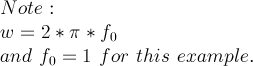
For B, the magnitude of the sine part b2 = 0.5*cos(0.52) = 0.43, and the magnitude of the cosine part is a2 = 0.5*sin(0.52) = 0.25.
For C, the magnitude of the sine part b16 = 0.3*cos(0.78) = 0.21, and the magnitude of the cosine part is a16 = 0.3*sin(0.78) = 0.21.
The Fourier Series equation for this particular case has these parts:
Equation 2
The full equation is thus:
Equation 3
So, here is the frequency plot of f(t) = D = A + B + C:
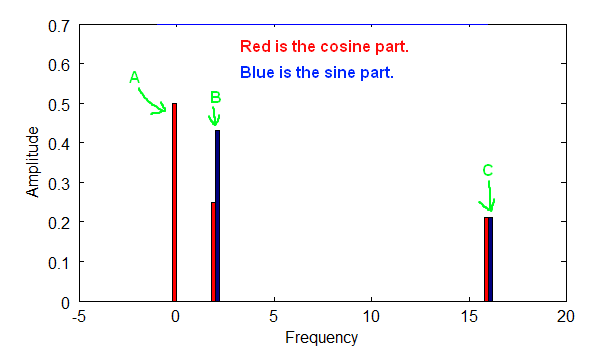
Above is a diagram of a frequency plot with both the cosine and sine parts for each frequency.
In the diagram above the sine and cosine parts in combination provide both the phase and magnitude for each frequency. In the above case the fundamental frequency is 1, but it could have been anything. A is at frequency zero, which simply refers to the DC part of the signal, i.e. the non-wave part. B is at 2 times the fundamental frequency, and C is at 16 times the fundamental frequency.
The Fundamental Frequency is the f part of w, where w = 2*pi*f. Notice how the plot points are only at integer multiples of the fundamental frequency, which follows from the nature of periodic waves, and from the way the orthogonality principle works. That frequency plot fully describes wave D, and can be used to reconstruct D if we so wish. Both the sine and cosine components of each wave are shown.
Another more common way that frequency spectrums are plotted is by combining the sine and cosine terms to get the magnitude of the wave at each frequency for the Fourier Series equation.
Equation 4
And phase angle can be calculated thus:
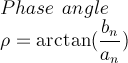
Equation 5
Below is a plot of the magnitudes for each frequency:
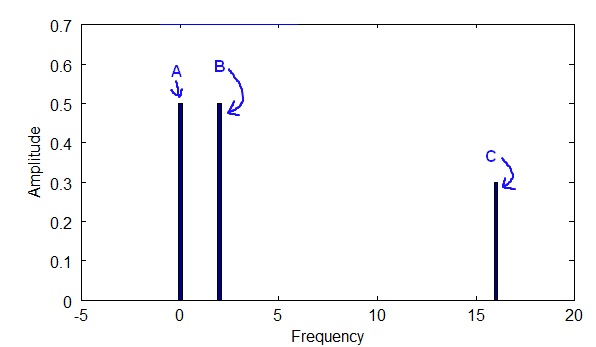
Above diagram shows the frequency plot for the magnitude at each frequency.
|